UARF
  • Home
  • About Us
    • Licensing
    • Internships
  • Programs
    • Starting Line
    • I-Corps
    • Spark Fund
    • ARCHAngels
    • Startup Support
    • Legal Support
  • Portfolio
  • Blog
  • News
  • Home
  • About Us
    • Licensing
    • Internships
  • Programs
    • Starting Line
    • I-Corps
    • Spark Fund
    • ARCHAngels
    • Startup Support
    • Legal Support
  • Portfolio
  • Blog
  • News
Search

The
   Entrepreneur Files

​A UARF weekly blog series featuring articles written from the UARF team members.

Learn about new ideas, business tips, and hear our personal stories about 
the things we learned from you, the entrepreneurs!
Scroll down for the latest article!

Market Sizing Basics

5/18/2023

0 Comments

 
Picture
Written by Linda Hale
​

TAM, SAM, SOM, Bottom-up, Top-Down – What does this mean… 
As you travel through your entrepreneurial journey you will inevitably be asked “how big is your market?” Maybe you’ve received a request for a “bottom-up, or top-down market analysis.” or been asked to identify your TAM, SAM, or SOM? 
Market sizing is important. Potential partners, investors, and other stakeholders need to know that the overall market opportunity is large enough to warrant their attention and that you understand your product’s specific portion of that opportunity. ​

So, let’s break it all down and empower you to tell your market sizing story in a quick and cohesive way. 
TAM, SAM, SOM 
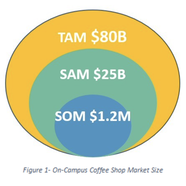
If you search for TAM, SAM, and SOM online, you will likely encounter an image that looks a bit like this coffee shop market size graphic. 
Picture
It’s a deceptively simple image that tells an important story of dollars and opportunity, but what does it mean? 

TAM (Total Available Market) sometimes referred to as Total Attainable or Addressable Market. 
TAM is the overall revenue opportunity that is available to a product or service if 100% market share is achieved.  
  • TAM helps determine the level of effort and funding that a person or company should put into a new idea or business line.  
  • TAM offers high-level insight on growth, funding, and investment potential. 
 
SAM (Serviceable Available Market) sometimes referred to as Served Attainable or Addressable Market. 
SAM is the portion or segment of TAM that a business can acquire based on its business model. 
  • A business is unlikely to address the total market due to limitations in business model such as specialization or geography. 
  • SAM is most useful for businesses to objectively estimate the portion of the total market they can use to determine their specific target market. 
 
SOM (Serviceable Obtainable Market) sometimes referred to as target market or share of the market. 
SOM represents the estimated portion of revenue an organization predicts it can capture within a specific product segment. 
  • It is crucial to measure SOM to determine how many customers would realistically benefit from buying its product or service. 
  • SOM is most useful for businesses to determine short-term growth targets.  
  • In the coffee shop image above, SOM is based on opening one coffee shop on one campus. Additional shops could be opened in the future, but for now, the business model is focused on one shop. 
 

As you move forward with your business model you may need to conduct a Top-Down or Bottom-up Market Analysis. Once you’ve found your TAM, SAM, and SOM, these analyses are easy to produce. 
 

Top-Down Analysis starts with the overall size of a market that includes your product, service, or technology. You will then break that overall market down to estimate your specific market. Top-Down analysis comes directly from TAM, SAM, and SOM.  
Using the coffee shop example above: 
  • Start with the entire yearly coffee market in the United States which is $80 Billion (TAM).  
  • Only 31% of the overall market comes from coffee shops, which reduces the market to $25 Billion (SAM). 
  • Coffee shops are geographically hyper-local, so we further filtered the market to a specific college campus, dropping the market share to $1.2 Million (SOM). 
$1.2 Million is the projected yearly sales from running a coffee shop on this campus using a top-down analysis. 
 

Bottom-up Analysis works in the opposite direction. Bottom-up starts with the smallest units of sales (# of customers, # of units, average price per unit, etc.) When you perform a “Bottom-Up” analysis, you’ll use those small units as building blocks to calculate market size. 
Using the same coffee shop example: 
  • Start with price per cup of coffee: $3.00. 
  • Multiply by the number of staff and students who buy coffee on campus: 1875. 
  • Multiply by the number of times they’ll buy coffee on campus per year: 205. 
$1,153.125 is the projected yearly sales from running a coffee shop on this campus using a bottom-up analysis. 
 

Just a heads up – Your top-down and bottom-up analyses don’t need to be exactly the same, but they should be similar. Double check your calculations or data sources if the numbers are widely different. 
 
Please reach out to UARF if you want to learn more about market sizing or any other startup topic. We are always happy to discuss your product, service, or technology. 

0 Comments


Leave a Reply.

    Categories

    All
    Communication
    Entrepreneurship
    Funding
    Goals And Achievements
    Guide For Students
    Insight
    Interviews
    Marketing
    Productivity And Organization
    Success Stories

    RSS Feed

411 Wolf Ledges Pkwy, Suite 208
​Akron, OH 44311
© COPYRIGHT 2018 UARF. ALL RIGHTS RESERVED.
  • Home
  • About Us
    • Licensing
    • Internships
  • Programs
    • Starting Line
    • I-Corps
    • Spark Fund
    • ARCHAngels
    • Startup Support
    • Legal Support
  • Portfolio
  • Blog
  • News